June 24, 2014
Just
Because the Fed Is Doing the Right Thing Now Is No Guarantee It Will Continue
to Do So
The Fed is continuing to
slow the growth in the amount of credit it is creating. In December 2013, the
year-over-year growth in the sum of Fed outright holdings of securities and its
net repurchase agreements (repurchase
agreements minus reverse repurchase agreements) was 41.1%. As of May, the
year-over-year growth in this sum had slowed to 24.8%. At the same time that
growth in Fed credit creation has slowed, growth in commercial bank credit
creation has increased. In December 2013, year-over-year growth in the break-adjusted
commercial bank credit was 1.0%. As of May, year-over-year growth in
break-adjusted commercial bank credit had risen to 3.6%. In the five months
ended May, the compound annual growth rate (CAGR) of break-adjusted commercial
bank credit was 7.4%. For reference, the median year-over-year growth in
monthly observations of break-adjusted commercial bank credit in the past 38
years was 7.0%. As shown in Chart 1,
year-over-year growth in the sum of
Fed credit and break-adjusted commercial bank credit was 8.5% in May compared
to a 38-year median growth rate of 7.1%.
Chart 1

Chart 2 shows the
deviation between the year-over-year percent change in the sum of Fed and
adjusted commercial bank credit from 7.1%, the 38-year median of the
year-over-year percent change in this credit sum. As one can see, the
year-over-year percent change in the sum of Fed and bank credit had been “deficient”,
often severely so, relative to its median from March 2008 through June 2013,
with the exception of January 2010. But, as was stated above, in the 12 months
ended May 2014, annualized growth in the sum of Fed and break-adjusted
commercial bank credit was 8.5%, 150 basis points above its 38-year median
percent change. So, the “drought” in the sum of Fed and adjusted commercial
bank credit appears to have been broken with the combination of the resumption
of Fed net acquisitions of securities in September 2012 and the recent
acceleration in the growth of commercial bank credit.
Chart 2

As a “refresher”, the
reason I pay particular attention to this credit sum is that growth in a
variant of it has a strong association positive association with growth in
gross domestic purchases (defined as gross domestic product plus imports minus exports). The credit variant includes, in addition to Fed
credit and commercial bank credit, credit created by saving institutions and
credit unions. Commercial banks, saving institutions and credit unions issue
deposits that are redeemable at par. Thus, they are referred to as depository
institutions. So, my credit variant is the sum of Fed credit and depository
institution credit. As I have explained in previous commentaries, what
distinguishes this credit variant from other measures of credit is that credit
created by the Fed and depository institutions is credit created figuratively
out of “thin air.” As such, it enables its recipients (borrowers) to increase
their current spending while not requiring any other entity to pare back its
current spending.
Plotted in Chart 3 are the
year-over-year percent changes of quarterly observations in the sum of Fed and
depository institution credit along with gross domestic purchases from Q1:1954
through Q1:2014. When the percent changes in thin-air credit were advanced by
one quarter, a higher positive correlation (0.63) was obtained than with the
two series compared contemporaneously or with changes in gross domestic
purchases advanced by one quarter. This suggests that growth in thin-air credit
“causes” growth in gross domestic purchases rather than vice versa. Because gross domestic purchases include only purchases
of currently-produced goods and services, they do not capture spending or
transactions on other things that additional thin-air credit might finance, e.g.,
purchases of financial assets or previously-produced real assets. I would argue
that the correlation between changes in thin-air credit compared to total
transactions would be higher than its comparison to gross domestic purchases.
Regrettably, I am not aware of a series that measures total nominal
transactions.
Chart 3

After an
economically-depressing, not to mention, psychologically-depressing, severe
winter, the U.S. economy appears to be responding predictably to the relatively
rapid growth in thin-air credit. Chart 4 shows that both nominal retail
spending on goods and the real production of goods have rebounded in growth in
recent months. Chart 5 shows that growth in combined new and existing home
sales has come roaring back. Chart 6 shows that the least-revised labor market
data, the weekly state unemployment insurance benefit data, are indicating an
improved labor market environment. Chart 7 shows that U.S. equity prices
continue to climb. And Chart 8 shows that no matter how you slice it or dice
it, the rate of increase in consumer prices for goods and services is
accelerating.
Chart 4

Chart 5

Chart 6

Chart 7
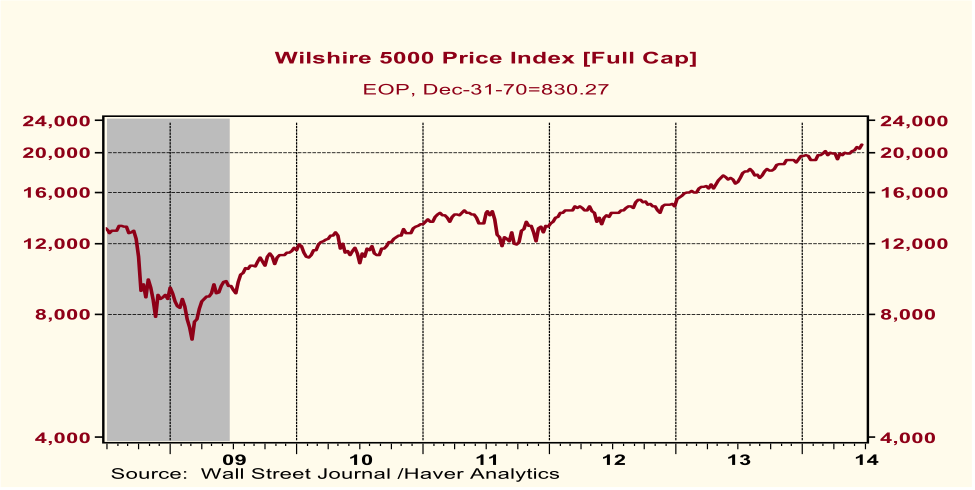
Chart 8

The upshot of all this is
that unless the Fed wants to create an undesirable inflationary environment in
terms of asset prices and/or consumer prices of goods and services, it is time
for the Fed to scale back its creation of credit, which it has been in the
process of doing since the January 2014 commencement of its monthly tapering in
the net acquisition of securities. The Fed also has stepped up the amount of
its reverse-repurchase-agreement operations, which serve to reduce Fed credit,
all else the same.
But the Fed pursuing the
correct monetary policy today for reasons
it does not understand instills little confidence that it will continue to
pursue the correct policy tomorrow.
When the Fed announced in September 2012 that it was going to resume its net
acquisitions of securities, it did not
say that it was doing so in order to boost the then anemic growth in thin-air
credit. No, it justified the resumption of net acquisitions of securities in
terms of lowering the yields on longer-maturity securities. The Fed never
publicly explained how it decided that $85 billion of net securities acquisitions
per month was the correct amount. Nor did it publicly explain why the $10
billion tapering of net securities acquisitions per FOMC meeting was the
correct amount. The Fed continues to be obsessed with the price of credit, an interest rate, rather than the quantity of credit. Moreover, on those
rare occasions when the Fed might mention the quantity of credit, it has never
made a distinction between thin-air credit and all other credit. But then,
neither have many other economic commentators, save for those of the Austrian
School.
Let’s make some
assumptions to give us an idea as to the likely behavior of thin-air credit
over the next year and a half. Assume
that the Fed continues to taper its net acquisitions of securities by $10
billion per FOMC meeting, implying that by the December 2014 meeting, it would
be making no net new outright acquisitions of securities to its balance sheet. Assume that the Fed maintains the amount of
its net repurchase agreements at a level equal to that of the average of the
first five months of 2014, $245.9 billion. Lastly, assume that break-adjusted
commercial bank credit continues to change at a CAGR of 7.4%, its annualized
growth rate in the five months ended May 2014. Chart 9 shows the actual
year-over-year percent changes in monthly observations of the sum of Fed and
break-adjusted commercial bank credit from December 2008 through May 2014 as
well as projected values through December 2015 based on the above assumptions.
Chart 9

At the end of 2013, this
credit sum had increased by 9.2% vs. December 2012, primarily because of the
Fed’s securities purchases. As of this past May, the year-over-year growth in
this credit sum had moderated to 8.5% because of the Fed’s tapering of its
securities purchases. If my assumptions regarding Fed and bank credit hold,
then by December 2014, the sum of Fed and bank credit growth would have
moderated further to 8.0% on a year-over-year basis.
Let’s pause here to
contemplate what this would imply for the pace of economic activity and the
behavior of financial markets. Back-to-back years of growth in the sum of Fed
and bank credit of 9.2% and 8.0% represents robust growth in this variant of
thin-air credit. After the weather-depressed first quarter of this year, I
would be expecting a strong rebound in the pace of real economic activity over
the remaining three quarters of 2014. I also would expect a continued modest
upward trend in the growth of consumer prices for goods and services. If this
relatively robust growth in nominal
economic activity were to occur, it would create expectations of financial
market participants that the Fed would start to raise its policy interest rates
sooner than what the Fed is
projecting. Thus, yields on Treasury securities from maturities of two years on
out, would move higher over the remaining course of 2014. Although the stronger
growth in nominal economic activity would be a plus for corporate profits, the
rise in interest rates would represent a higher discount factor applied to
corporate profits. Thus, although U.S. equity prices could continue to move
higher in 2014, the rise in market interest rates would represent a headwind
for equity prices.
But if my projections for
growth in thin-air credit for 2015 are close to the mark, 2015 would be a more
challenging year for real economic growth and the equity market. Slowing from
8.0% to 5.5% in thin-air credit growth would represent a significant deceleration.
Depending on how the Fed reacts early in 2015 to stronger real growth and
higher consumer price inflation in 2014 than it expected, even 5.5% growth in
thin-air credit in 2015 might be hard to achieve. If things play out the way I
expect in 2014, Fed hawks’ influence on monetary policy decisions would
increase in early 2015. Thus, Fed interest rate hikes could come early in 2015.
All else the same, these rate hikes would act as a brake on commercial bank
credit creation. Thus, the 2015 7.44% CAGR in bank credit assumed in my
projection could be too high, which, in turn, would render the assumed 5.5%
growth in the sum of Fed and bank credit too high.
As I indicated at the
outset, the slowing in Fed credit creation in 2014 seems entirely prudent to
me. But I would have a lot more confidence in the correctness of Fed policy in subsequent years if I believed the Fed understood
why it is correct to slow its credit creation in 2014. Without this
understanding, there is a high likelihood of significant Fed policy mistakes in
subsequent years.
I want to close on a note
of personal humility. (As my brother, may he rest in peace, used to remind me,
I have so much to be humble about.) In my projections of thin-air credit
growth, I have made assumptions about Fed credit growth and commercial bank
credit growth. I feel most confident about Fed credit growth and least
confident about bank credit growth. After all, my assumption of 7.44% CAGR in
bank credit going forward is nothing but the simplistic assumption that what
happened in the past 5 months will persist in the next 19 months. Thus, the
outlook for thin-air credit growth could change significantly in the weeks and
months ahead. That is why every Friday afternoon I update my spreadsheet on it.
If things do change significantly from what I have assumed here, I will alert
you to this.
Paul L. Kasriel
Econtrarian, LLC
Senior Economic and
Investment Adviser
Legacy Private Trust Co.
of Neenah, WI
1 920 818 0236