March 16, 2015
The Fed – Drunken Coxswain of the SS
America
Back on January 25, I penned a piece entitled “The Fed
– Lucky or Smart?”. In that commentary I argued that the Fed was managing
the supply of total thin-air credit, i.e., the sum of commercial bank credit
and depository institution reserves at the Fed, in a responsible manner such
that growth in nominal economic activity would neither be too hot nor too cold.
I noted that this Fed management of the supply of thin-air credit in mid
January was more likely due to luck than to “smarts” on the part of our central
bank. I also implicitly posed the question: What if the Fed’s luck should
change for the worse without its “smarts” changing for better? Well, that
question now is relevant. After rebounding to a rate approximately equal to its
long-run median, growth in total thin-air credit sharply decelerated in
February, both on a year-over-year basis as well as a three-month basis (see
Chart 1).
Chart 1

In the first nine months of 2014, the year-over-year
growth rate of total thin-air credit averaged 8.8% per month. In the final
three months of 2014, the average monthly growth rate sank by 300 basis points
to 5.8%. Then in January 2015, the year-over-year growth rate of total thin-air
credit rebounded to 7.5% only to sink to 4.1% in February. The coxswain is the
person in charge of steering a ship. It seems as though the Fed coxswain in
charge of steering the U.S. economy should be tested for sobriety because she
appears to be steering an erratic course.
One could challenge my allegation of a drunken Fed
coxswain by questioning whether the sharp deceleration in the growth of
thin-air credit, save for February’s rebound, has had any effect on economic
activity. I submit it has.
Firstly, I want to present exhibits of the recent
behavior of the U.S. economy that will either not ever be revised or will be
revised only minimally. First up is the ISM Manufacturing Purchasing Managers’
Composite Index (PMI). As shown in Chart
2, the PMI has declined in each of the past four months ended February 2015.
Chart 2

Unit sales of light motor vehicles have contracted in
each of the past three months ended February 2015, as shown in Chart 3.
Chart 3

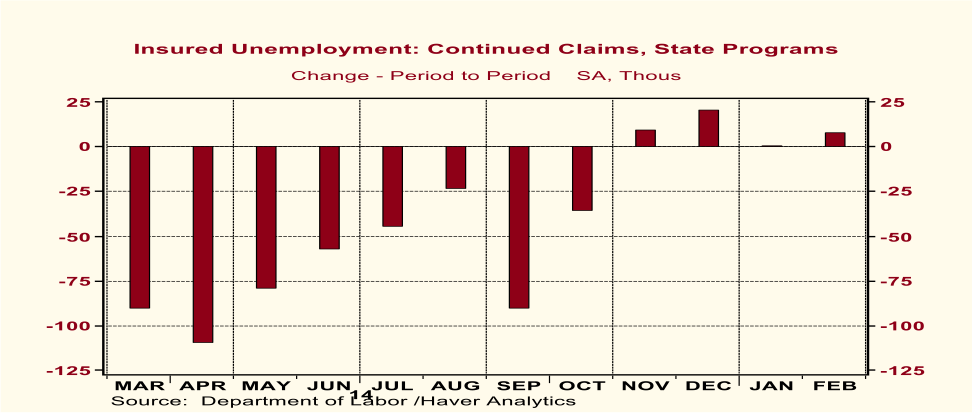
Continuing state unemployment insurance claims have
increased in each of the past four months, as shown in Chart 4.
Chart 4
Because of its history of frequent and often significant
revisions, I have less faith in the reliability of recent observations of
nominal retail sales. But they paint the same general picture of the more
reliable economic indicators cited above – that the economy has hit a “soft
patch”. Total nominal retail sales have
contracted in each of the past three months ended February 2015, as shown in
Chart 5. Shown also in Chart 5 is that nominal retail sales excluding those of
gasoline stations contracted in two of the past three months ended February
2015. It was against my better judgment that I excluded nominal gasoline sales
from nominal retail sales. Yes, I know that when gasoline prices fall, nominal sales of gasoline also decline
because households do not instantaneously drive more due to the lower
gasoline prices. But with less of their nominal income being spent on gasoline,
households might increase their nominal expenditures on other more
discretionary goods and services by an amount equal to their nominal gasoline
expenditure “savings”. This did not happen in each of three months ended
February 2015.
Chart 5

One tangential thought regarding the February 2015 retail
sales report. The consensus estimate of the change in total nominal February
retail sales was an increase of 0.4%.
The consensus did not even get the sign of the change correct. The Census
Bureau reported that February total retail sales decreased by 0.6%. What was the common excuse for the big miss by
the consensus? Blame it on the weather. But, wait a minute. The economic forecasters did not have to
forecast the February weather. The actual February weather was a known fact
when the forecast of February retail sales was made. Yes, the winter weather of this past February was unusually severe. But
why wasn’t this fact incorporated into economists’ collective forecast of
February retail sales?
I know that forecasting monthly economic data accurately is very difficult. I know
that if a reporter calls you for a forecast and you tell him/her that you don’t
have a clue, that reporter won’t call you again. And if reporters stop calling
you, your job could be in jeopardy, because what, after all, is the principal
function of a Street economist? Marketing the name of your employer. Why
doesn’t some enterprising economics reporter do a study on the accuracy of
consensus forecasts of economic data? Perhaps if the media could be weaned off
this mugs game, then Street economists could do something more useful, such as
conducting research as to what really drives the cyclical behavior of the
economy.
But I digress. Back to the drunken Fed coxswain. Why did
growth in total thin-air credit take a dive in February 2015 and why was it
relatively weak in November and December 2014? Was it because of weak growth in
the commercial bank credit component? No. The data plotted in Chart 6 show that
commercial bank credit growth, both on a year-over-year basis as well as a
three-month annualized basis, has been quite strong.
Chart 6

That leaves but one explanation for the recent weakness
in total thin-air credit growth – weakness in the Fed component, i.e.,
depository institution reserves at the Fed. This is illustrated in Chart 7.
Given the strong growth in commercial bank credit in recent months, it is
entirely appropriate that Fed credit growth should have slowed from what it was
when the QE III policy was being pursued. But the Fed has overdone it. In
September 2014, the year-over-year change in Fed reserves was plus 17.3%. In February 2015, it was minus 10.1%. In the three months ended
2014, the annualized change in Fed reserves was plus 16.4%. In the three months ended February 2015, it was minus 29.5%.
Chart 7

The Fed is steering its component of thin-air credit like
a drunken coxswain. As a result, total
thin-air credit is behaving in a similar fashion. And as a result of these
frequent and, most likely, unintentional course changes in thin-air credit
growth, my near-term forecasts of the pace of economic activity also have
become erratic. The erratic behavior of my economic forecasts is
inconsequential. But what is consequential is the effect on the economy and
financial markets. If the Fed continues
to “steer” growth in thin-air credit with these seemingly erratic and random
course changes, then the economy will behave in a volatile fashion, which will
impart volatility to the financial markets. Other than short-term
financial-market traders, no one will benefit from this.
There is continued interest in Congress to impose some
“rules” on the Fed as to how it should conduct monetary policy. I am
sympathetic to the general notion of imposing rules on the Fed – but not
Taylor’s [interest rate] Rule. We will have to leave a discussion of new rules
on the Fed for another commentary.
Paul L. Kasriel
Founder and Administrative Asst., Econtrarian, LLC
1-920-818-0236
Sr. Economic & Investment Advisor, Legacy Private
Trust Co., Neenah, WI