November 29, 2017
The S&P 500 Is Not Expensive According to the Kasriel Valuation Model
In each of the first three quarters of 2017, there have
been double-digit year-over-year percentage increases in the quarterly average
level of the S&P 500 stock-price index – 19.3% in Q1, 15.5% in Q2 and 14.2%
in Q3. Although there were year-over-year contractions in the S&P 500 index
of 5.6% in Q1:2016 and 1.3% in Q2:2016, there has not been a year-over-year
contraction of 10% or more since Q3:2009. With the S&P 500 stock-price
index hitting record highs in recent weeks and no contraction of 10% or more in
it in eight years, one could reasonably wonder if large cap stocks have gotten
expensive. In terms of the Kasriel stock market valuation model, the S&P
500 stock price index was not
expensive in an historical context as of this past third quarter.
The essence of the Kasriel stock market valuation model
is a calculated theoretical market
capitalization of a group of stocks compared with the actual market capitalization. If the actual market cap is larger
than the theoretical market cap, then the stock market group is overvalued. If
the actual market cap is less than the theoretical market cap, then the stock
market group is undervalued.
The theoretical market cap is calculated by discounting
corporate earnings by a corporate bond yield. Thus, the theoretical market cap
varies positively with the level of earnings and negatively with the level of
bond yields. For corporate earnings, I have used quarterly observations of
aggregate S&P 500 reported
earnings, starting in 1964:Q1. (I would have preferred to use operating earnings, earnings adjusted
for one-time special events. But in my database, operating earnings data do not
begin until 1988:Q1.) I smooth the earnings series with some highfalutin
econometric technique called the Hodrick-Prescott filter. The Hodrick-Prescott
filter is supposed to remove the cyclical component of a series. Think of it as
less arbitrary technique than a moving average, such as Shiller’s use of a
10-year moving average. Why 10 years? Why not 9 or 11 years? So, my theoretical
S&P 500 market cap is Hodrick-Prescott filtered quarterly aggregate S&P
earnings discounted by the quarterly average level of the corporate BAA bond
yield. After calculating the theoretical market cap of the S&P 500 stocks,
I calculate the percentage that the actual S&P market cap is over or under
the theoretical S&P 500 market cap.
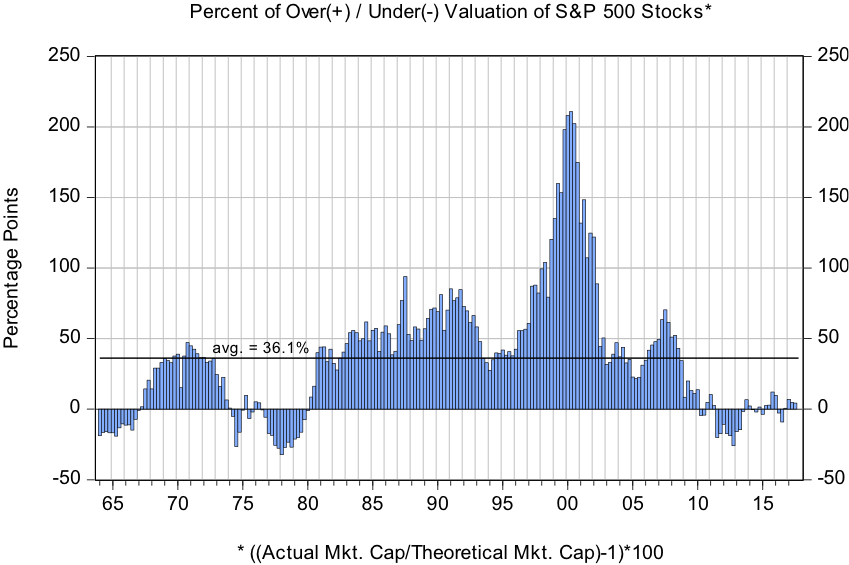
The results of these calculations are plotted in Chart 1.
According to the Kasriel model, S&P 500 stocks in the aggregate were
overvalued by 4.4% in 2017:Q3. Compared to the average overvaluation of 36.1%
over the entire sample period, a 4.4% overvaluation is small potatoes. The
level of the corporate bond yield used to discount smoothed annualized earnings
of $899.1 billion in this past third quarter was 4.35%. Given the same level of
annualized earnings, a 100 basis point increase in the corporate bond yield
would put third-quarter S&P 500 stocks 28.4% overvalued, still short of the
sample average of 36.1% overvaluation.
Chart 1
Testing the lead/lag relationship between the Kasriel
valuation model and the year-over-year percent change in the S&P 500 stock
price index shows that the highest negative correlation (-.20) between the two
series is obtained when the over/under valuation measure is lagged by five quarters. So, the current quarter’s over/under valuation
estimate has its greatest effect on the year-over-change in the S&P 500
stock price index five quarters in the future.
Let’s plot the year-over-year percent change in the quarterly average of the
S&P 500 stock price index against the Kasriel model of over/under valuation
estimates lagged five quarters to see
how the Kasriel model comports with the behavior of stock prices. These data
are plotted in Chart 2.
Given the low absolute value of the correlation
coefficient between the two series, 0.20, you would be correct in assuming that
the Kasriel over/under valuation model does not do a stellar job in predicting
the year-over-year percent changes in the S&P 500 stock price index. (Gosh,
and I thought it would be easy to accurately predict stock prices!) But the
Kasriel model does catch some big moves. In terms of stock price rallies, the
Kasriel model does show stocks were undervalued
preceding the stock price rallies of the mid 1960s, mid 1970s,
early 1980s and early 2010s. And the Kasriel model also shows that stocks were
extremely overvalued preceding the stock price declines of the late 1980s, early 2000s
and late 2000s. However, significant stock price rallies in the early 1970s, in
the early to mid 1980s, in the early 1990s and in the late 1990s were preceded by Kasriel model overvaluations near or above the average
overvaluation reading of 36.1%, which again shows that the stock market can
stay overvalued longer than you can meet the margin calls on your short
positions!
Chart 2

2017:Q3 marks the 34th quarter in which the
S&P 500 stock price index has gone without a quarter-to-quarter decline of
10% or more. In the past 34 quarters, the S&P 500 stock price index has
increased at a compound annual rate of 14.0%. The average 34-quarter compound
annual rate of change in the S&P price index has been 6.6% in the period
from Q1:1964 through Q3:2017. Despite this bull-market run, S&P 500 stocks
in the aggregate do not appear to be overvalued in an historical context. Hodrick-Prescott
filtered S&P 500 aggregate earnings grew at a compound annual rate of 6.55%
in the 34 quarters ended 2017:Q3, which is less than the average 34-quarter
compound annual growth in these earning of 7.75% in the period from 1972:Q3
through 2017:Q3. So, the key driver of the theoretical S&P 500 market cap
and thus undervaluation or relatively low overvaluation of the S&P 500 in
the past 34 quarters has been the low level of the discount factor, the yield
on corporate BAA bonds.
Given the low correlation coefficient of -0.20 between
percentage changes in the S&P 500 stock price index and the Kasriel model
over/under valuation estimates, there obviously are other factors that have significant
effects on the behavior of S&P 500 stock prices such as expected government tax and regulatory
policies, as well as geopolitical events. Thus, if the S&P 500 stock price
index were to plunge 10% or more in the next four quarters or so, it would
likely be the result of some factor other
than stocks currently being overvalued. (Of course, by writing this, I
probably have put the “kiss of death” on the U.S. stock market!)
Paul L. Kasriel
Founder, Econtrarian LLC
Senior Economic and Investment Advisor
1-920-818-0236
“For most of human
history, it made good adaptive sense to be fearful and emphasize the negative;
any mistake could be fatal”, Joost Swarte
∆ + 10 = A Good
Life
This comment has been removed by a blog administrator.
ReplyDeletethe question is of course not whether (US) shares are extremely expensive, a serious scholar/economist en nobel laureate like Shiller is very clear about that, the real question is how long will the (US) music continue to play; the answer is: probably (much) longer than many people think (see yield curve, employment among 15-54 age cohorte, wage inflation), beware black (Chinese, Korean, ...) swans though:)
ReplyDeletehttps://www.crescat.net/crescat-capital-quarterly-investor-letter-q3-2017/ US large cap stocks are the most overvalued in history, higher than prior speculative mania market peaks in 1929 and 2000. We prove it conclusively across six comprehensive dimensions:
ReplyDeletePrice to Sales
Price to Book
Enterprise Value to Sales
Enterprise Value to EBITDA
Price to Earnings
Enterprise Value to Free Cash Flow
FINANCIAL BREAKTHROUGH
ReplyDeleteLife indeed is GRACE, I'am Daan Sophia currently in California USA. I would like to share my experience with you guys on how I got a loan of $185,000.00 USD to clear my bank draft and start up a new business. It all started when i lost my home and belongings due to the bank draft I took to offset some bills and some personal needs. I became so desperate and began to seek for funds at all means. Luckily for me I heard a colleague of mine talking about this company, I got interested although i was scared of being scammed, I was compelled by my situation and had no choice than to seek advise from my friend regarding this very company and was given their contact number, getting intouch with them really made me skeptical due to my past experience with online lenders, little did i know this very Company "PROGRESSIVE LOAN INC. was a godsent to me and my family and the entire Internet World, this company has been of great help to me and some of my colleague and today am a proud owner of well organized business and responsibilities are well handled all thanks to Josef Lewis of (progresiveloan@yahoo.com).. So if really you are genuinely in need of a loan either to expand or start up your own business or in any form of financial difficulty, i advise you give Mr Josef Lewis of Progressive loan the opportunity of financial upliftment in your life Email: progresiveloan@yahoo.com OR Call/Text +1(603) 786-7565 and not fall victim of online scam in the name of getting a loan. thanks